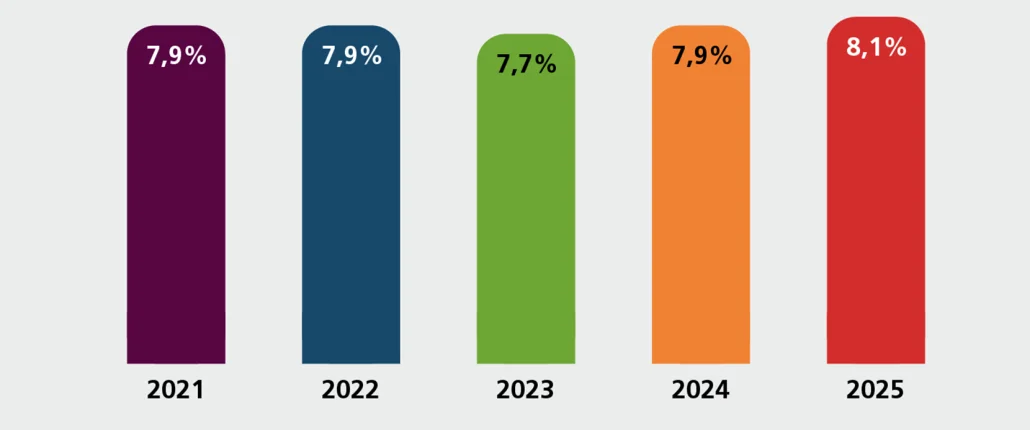
Balkendiagramm zur Anzahl Verbraucher mit Zahlungsstörungen in den Jahren 2021 (7,9%), 2022 (7,9%), 2023 (7,7%), 2024 (7,9%) und 2025 (8,1%)
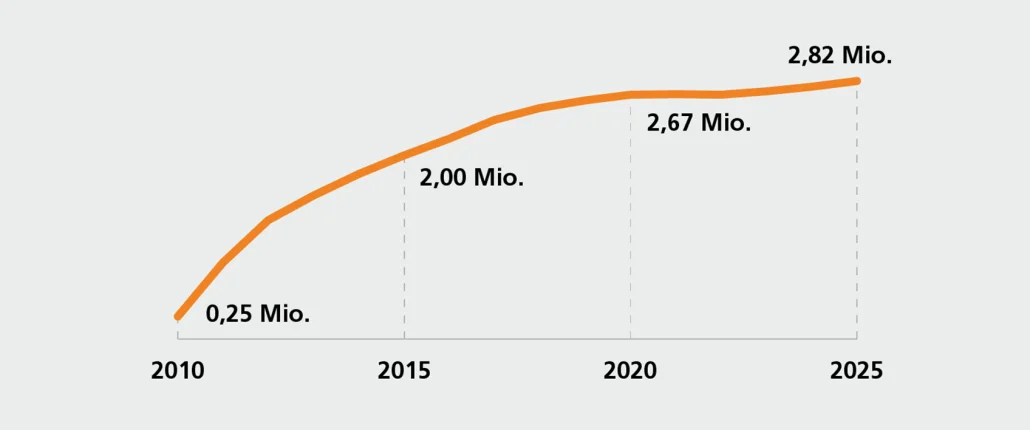
Line graph showing the number of people with garnishment-protected accounts in 2010 (0.25 million), 2015 (2 million), 2020 (2.67 million), and 2025 (2.82 million)
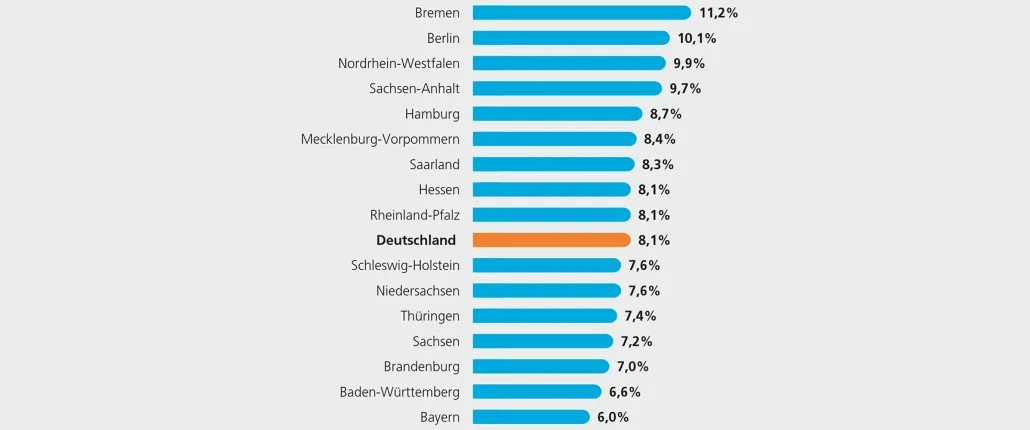
Bar chart showing German states by percentage of people with payment difficulties (as a share of the population)
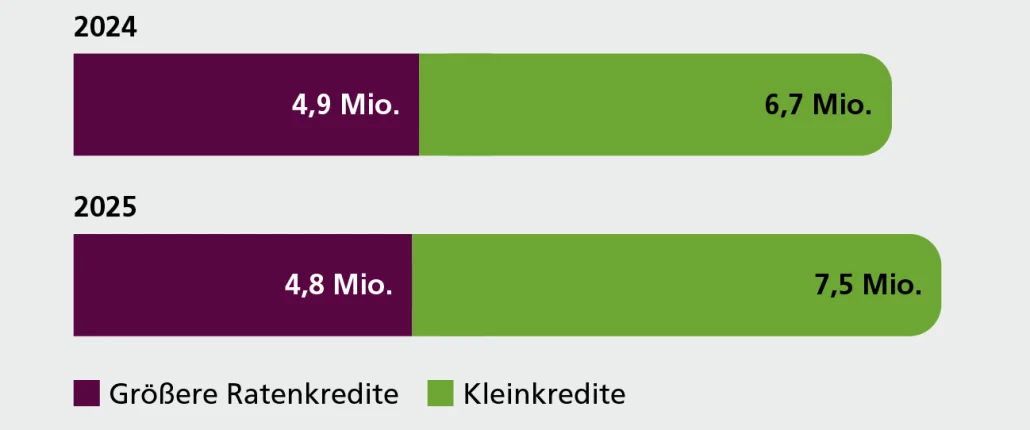
Bar chart showing the number of new installment loans taken out in 2024 (larger installment loans: 4.9 million; small loans: 6.7 million) and 2025 (larger installment loans: 4.8 million; small loans: 7.5 million)
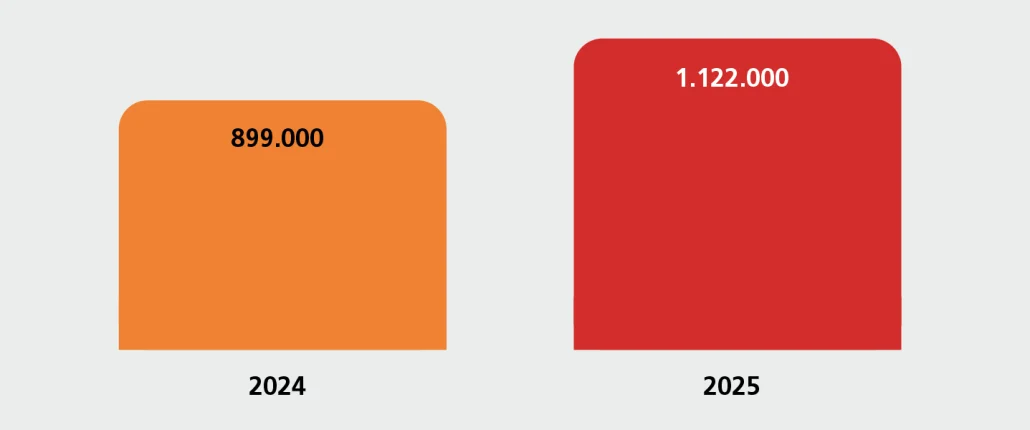
Number of new mortgage loans issued in 2024 (899,000) and 2025 (1,122,000)